top of page
Project Title
MELTING BLOCKS
Visualizing climate change data
PROJECT BRIEF
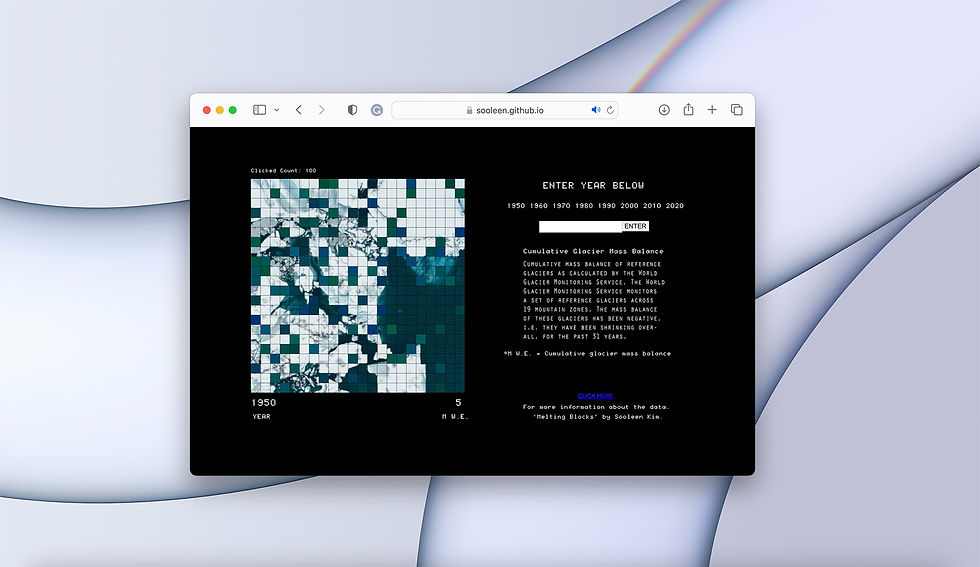
Reinterpreted and visualized climate data into an interactive website to make the data a more relatable and visceral experience. The aim was to show the relationship between the glacier mass data and sea level rise clearly through human interaction.
OUTPUT
SKILLS
TOOLS
ROLE / DURATION
Interactive website
Interactive Design
Web Design
Creative Coding
Data Visualization
Visual Communication
P5js
Html CSS Java Adobe Photoshop
Sole Designer /
2 Months
Original Data
Glacier Mass
Decrease
Connection to
Sea Level Rise

Glacier Mass Balance
This climate change data is provided by Met Office under its relation to sea level rise.
Project Goal
1. Visualize the data for a more visceral and relatable experience
2. Create a clear visual connection to sea level rise
Aimed to visually show the decrease in the glacier mass balance and create a connection to sea level rise.


Visual Inspirations

Games and Aerial Maps
Decided to use an aerial map of a glacier and gamify the scene to make the data into an interactive experience.
Aerial map
with grids
Gamification
Gamifying Data
Aerial Maps
Step 1: Grid-ify


Aerial Map of Glaciers
Grid-ifying the aerial image of glaciers in order to apply quantified data.
Edited the image to be more linear to emphasize the grid and quantified data.
Before
After
Re-Quantifying Original Data to Visualize
Total number of boxes
484 (22x22)
Number of boxes filled in 2020
400
Number of boxes filled in 1950
100
Number of boxes to be filled between1960 to 2020
300
300 boxes change per 30 m w.e.
10 boxes = 1 m w.e
Filled Boxes
Year
100
1950
130
1960
150
1970
175
1980
200
1990
250
2000
300
2010
400
2020
Step 2: Re-quantify
Translate the Data to Match the 22x 22 Grid
Set an x number of boxes to start and calculated how many boxes to add per year based on the original data.

Step 3: Code on P5JS
Combine the Data and the Map

1960
130 boxes filled


1970
150 boxes filled
1980
175 boxes filled
1990
200 boxes filled


2000
250 boxes filled
2010
300 boxes filled
2020
400 boxes filled
Code using P5js to output x number of filled boxes by inputting the year and vice versa.
1950
100 boxes filled


bottom of page